GSI Performance Monitoring
The primary goal of green stormwater infrastucture monitoring is to measure performance of the system (i.e., to see how well it infiltrates and/or stores stormwater runoff). Monitoring is conducted at individual sites after construction, and it is intended to complement other Water Department activities such as the monitoring of the sewer system, receiving waters (rivers and streams) and groundwater.
Please refer to Section 4 of PWD's Comprehensive Monitoring Plan and its Appendices for more details.
Water Level Monitoring
Making observations of the water level in a stormwater tree trench allows us to make several estimates about how well the system is performing: How it responds to storms, how much runoff is being stored, and the rate at which water is infiltrating into the ground.
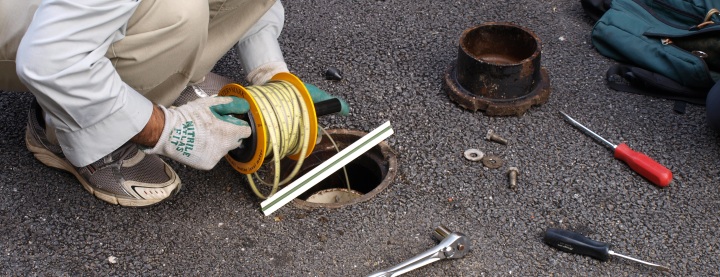
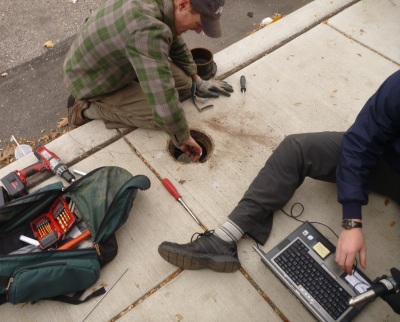
PWD's stormwater tree trench designs include observation wells that extend beneath the system's stone/gravel layer. This capped well can house a pressure transducer with data logging capabilities. Readings from the pressure transducer are converted to correspond to the height of the water in the tree trench, and the water level is corrected to compensate for variations in barometric pressure. As a field check, water levels can also be measured manually with electric tape.
Selected green stormwater infrastructure (GSI) sites around the city are currently being monitored by PWD. For more information and standard operating procedure, see Appendix C of the Comprehensive Monitoring Plan.
Water Level Analysis

After water level data have been collected from a particular GSI site, they are compared to rainfall data from a nearby rain gauge on a hydrograph plot (pictured at left, click to enlarge image). It is particularly instructive to look at individual storm events over a period of a year to account for seasonal variations and differences in rainfall distribution.
The expected pattern in the hydrograph is an increase in water level corresponding to increased precipitation and runoff, and deviations from the pattern may indicate a problem in the system. A tree trench that does not fill with water may indicate a clogged distribution pipe, for example.
Using some basic assumptions about the GSI site's drainage area and the data that has been collected, it is possible to estimate how much runoff the system stores and how well the water is infiltrating into the ground. Appendix C of the Comprehensive Monitoring Plan contains more detail about data analysis.
Groundwater Level Monitoring
In addition to making water level observations within the GSI systems, PWD monitors local groundwater levels both in proximity to selected GSI sites (to observe the effects of lateral groundwater monitoring) and on a regional scale via a groundwater well monitoring network in cooperation with the U.S. Geological Survey. The monitoring network currently consists of 19 active groundwater wells in the Philadelphia area to provide long-term water level data and track the impact of stormwater management practices and global climate change.
Section 8 of the Comprehensive Monitoring Plan describes the PWD-USGS groundwater well monitoring network in detail.